How to Stream Live Polymarket Prices and Build Real-Time Charts (No-Code)
Learn how to stream real-time Polymarket market data using the WebSocket market channel and build live prediction market charts — no code required.
Prediction markets move quickly.
Prices update constantly as traders place orders, cancel orders, and execute trades based on new information. Every transaction shifts the market’s estimate of the probability of an outcome.
Most users only see these movements through the Polymarket interface, where prices update visually on the page.
But behind the scenes, the platform is continuously streaming market data in real time.
Polymarket exposes this data through a WebSocket market channel, allowing developers and analysts to receive live updates about market activity as it happens.
This includes:
- price changes
- orderbook updates
- trade executions
- bid / ask spreads
- new market creation
- market resolution events
In this guide we’ll walk through how the Polymarket real-time data stream works, why it’s useful for analysis, and how to connect to it without writing code in order to build live updating prediction market charts.
How Polymarket Streams Market Data
Unlike traditional REST API endpoints, which return data when you request it, a WebSocket keeps a persistent connection open and continuously pushes new information to the client.
Polymarket’s market stream works exactly this way.
The WebSocket endpoint is:
wss://ws-subscriptions-clob.polymarket.com/ws/market
Once connected, a client subscribes to one or more asset IDs corresponding to specific markets or outcomes.
Whenever activity occurs in those markets, the stream emits a message containing the update.
This approach is common in financial markets where traders need to monitor orderbooks, spreads, and trades in real time.
Prediction markets operate in a similar way.
Prices change as traders express their beliefs through buying and selling contracts, so live data streams provide a much clearer view of how a market evolves.
For the full developer reference on subscribing with asset IDs and reading market events, see Use the Polymarket CLOB WebSocket market channel.
What Types of Events Are Streamed?
The market channel emits several types of events depending on what is happening inside the market.
Some of the most useful include:
Price Change Events
A price_change event occurs whenever a new order is placed or an existing order is cancelled.
These messages update the orderbook and may shift the best bid or ask price.
Tracking these changes helps analysts observe how liquidity is positioned around the current market price.
Last Trade Price
Whenever a buy and sell order match, the system emits a last_trade_price event.
This represents an actual trade execution.
These events are what drive live price charts, since they reflect the latest price at which traders were willing to transact.
Orderbook Snapshots
When a client first subscribes to a market, the WebSocket sends a book event.
This includes the current bid and ask levels for the market, providing a snapshot of available liquidity.
Subsequent updates modify this snapshot as orders enter and leave the book.
Best Bid and Ask
The stream can also emit best_bid_ask events, which track the top levels of the orderbook.
This includes:
- best bid
- best ask
- spread
These values are commonly used when visualizing market conditions.
Why Real-Time Prediction Market Data Matters
Real-time market streams unlock a much deeper level of analysis than static API responses.
With continuous data you can:
- track live probability movements
- monitor market volatility
- observe liquidity shifts
- analyze trade flow
- build real-time price charts
These types of tools are common in traditional trading platforms but much less common in prediction markets.
As prediction markets grow, the ability to analyze their data systematically will become increasingly valuable for researchers, traders, and analysts.
The Challenge of Working With WebSockets
While the data itself is extremely useful, working with WebSocket streams can be complex.
A typical implementation requires:
- maintaining a persistent connection
- subscribing to markets using asset IDs
- parsing streaming JSON messages
- storing incoming events
- building visualizations from the data
For many users, the technical overhead of building this infrastructure outweighs the benefits of accessing the stream.
This is where no-code tools become useful.
Instead of writing a custom WebSocket client, you can connect to the market stream and work with the data directly.
Connecting the Polymarket Market Stream Without Code
Tools like Lychee allow users to subscribe to Polymarket’s real-time market data and immediately work with it as structured datasets.
Once the stream is connected, incoming events can be visualized, filtered, or exported without building custom infrastructure.
This makes it possible to create live prediction market charts in just a few steps.
Below is a simple walkthrough of how to set up a live chart using the market price stream.
How to Build a Live Polymarket Price Chart
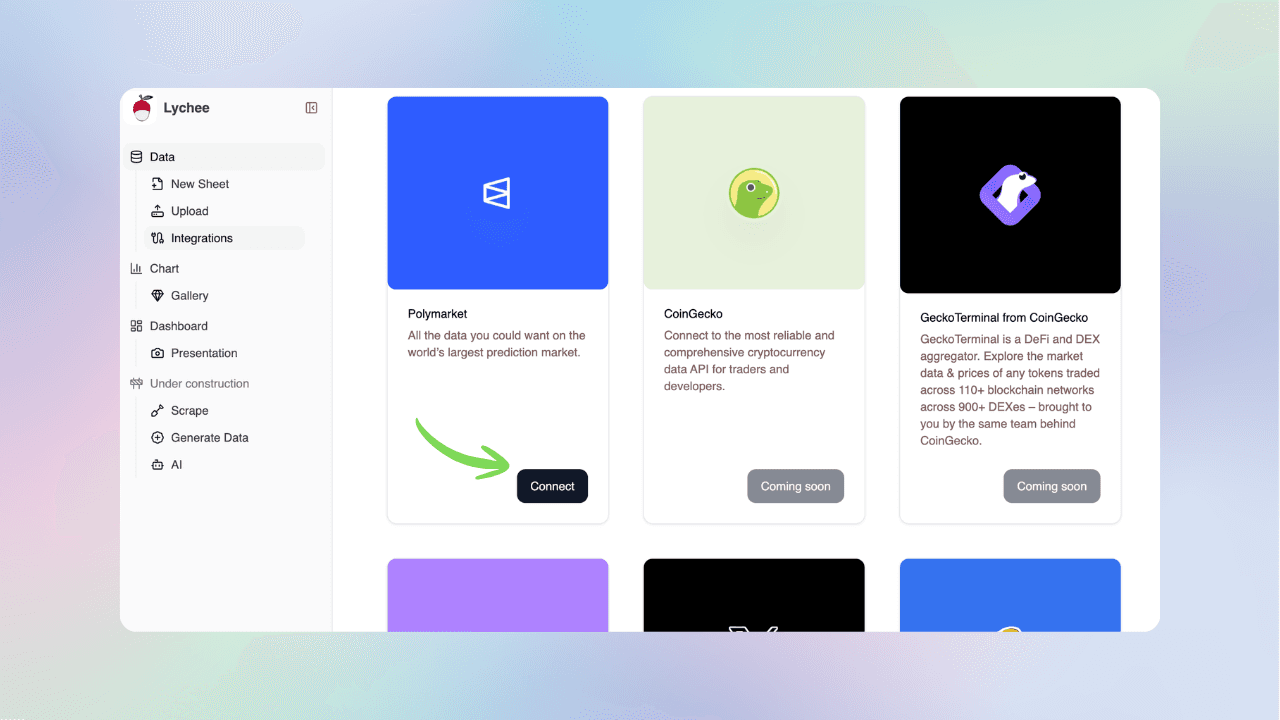
1. Connect to Polymarket
Navigate to the Integrations section and select Connect under the Polymarket integration.
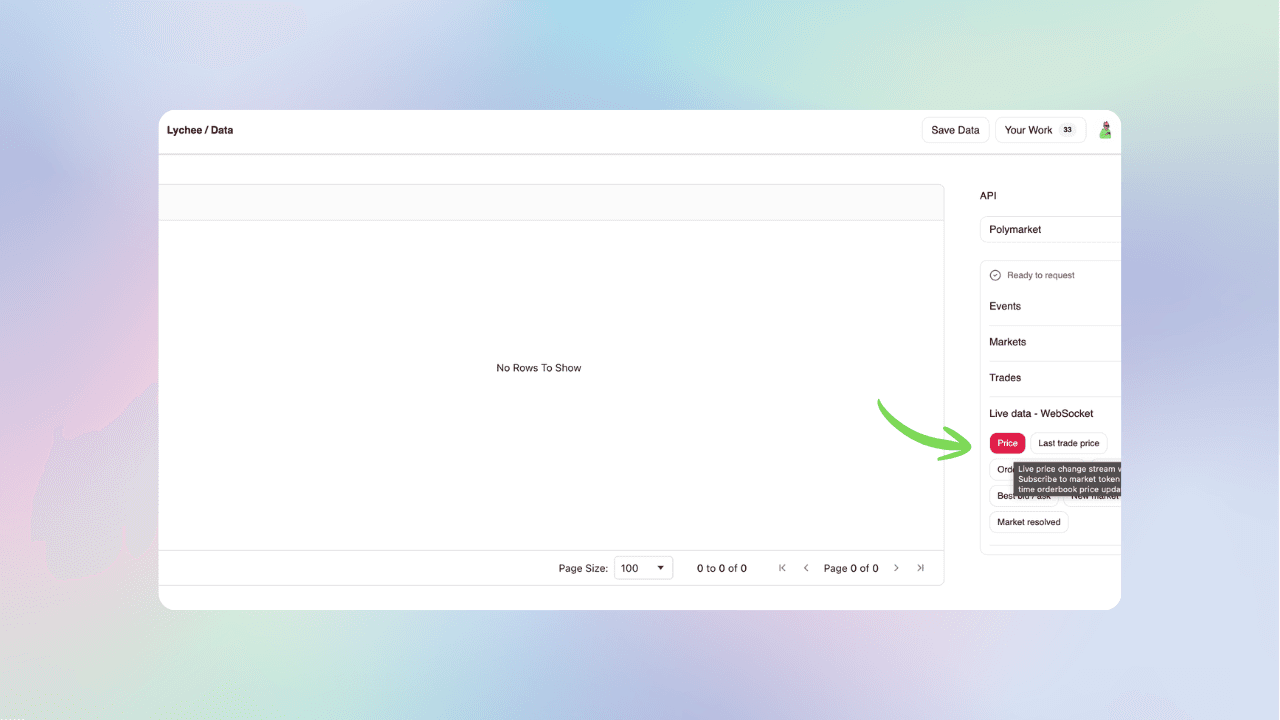
2. Select the Market Data Stream
Choose which type of market data you want to stream.
For this example, select the Prices endpoint.
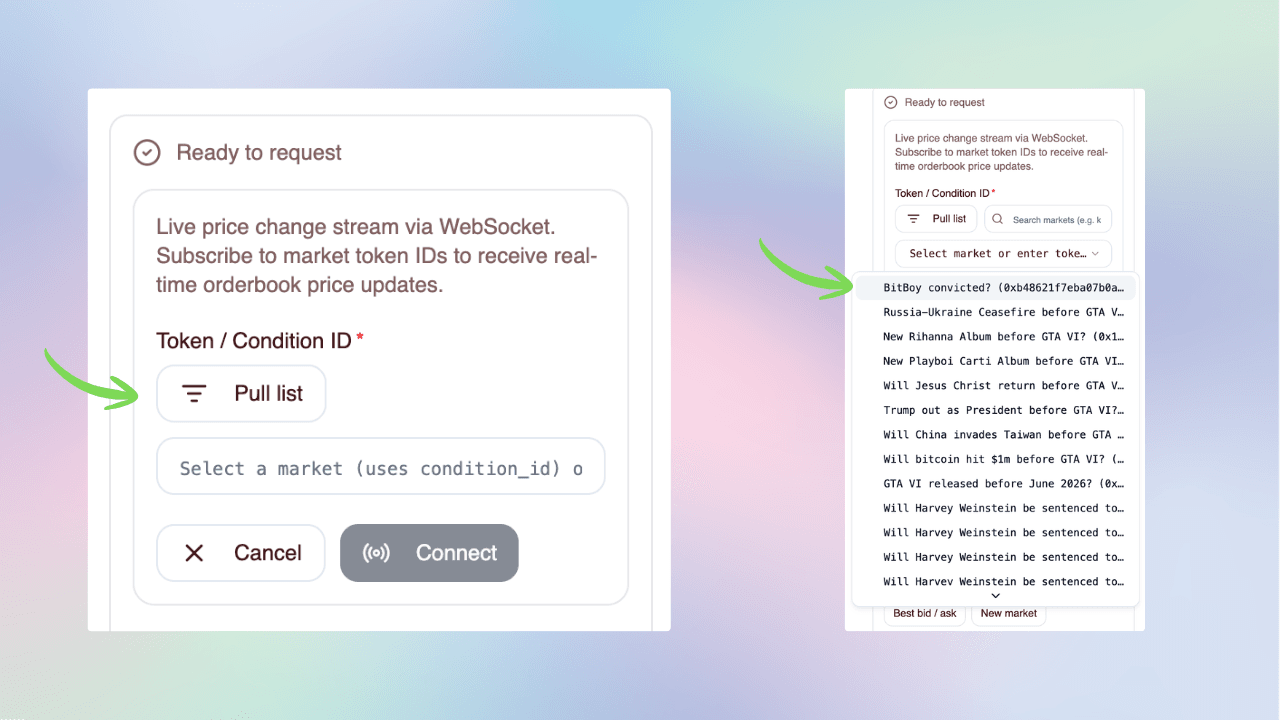
3. Select the Market Token
If you already know the market token ID, paste it directly into the field.
If not, select Pull Markets to automatically retrieve available markets and choose one from the list.
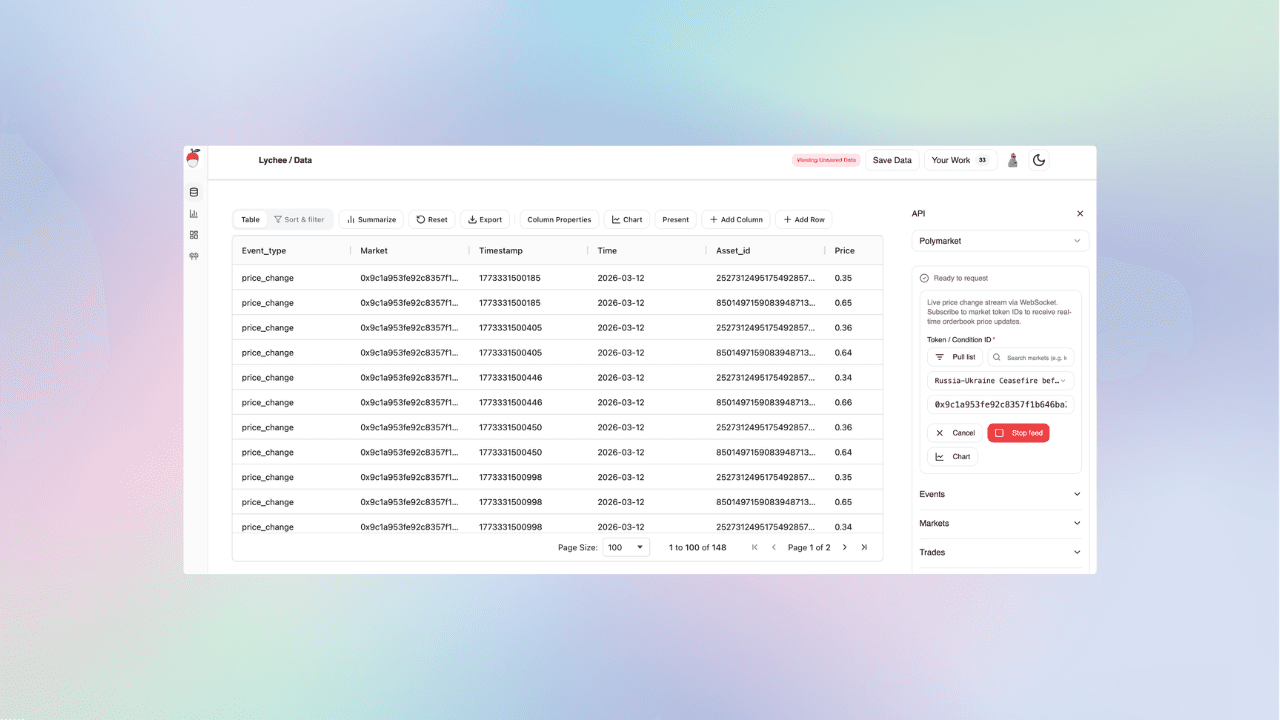
4. Start the Live Data Connection
Once the market token is selected, the live data connection is established.
Developers often refer to this type of continuous stream as a webhook-style data connection, where updates are delivered automatically as they occur.
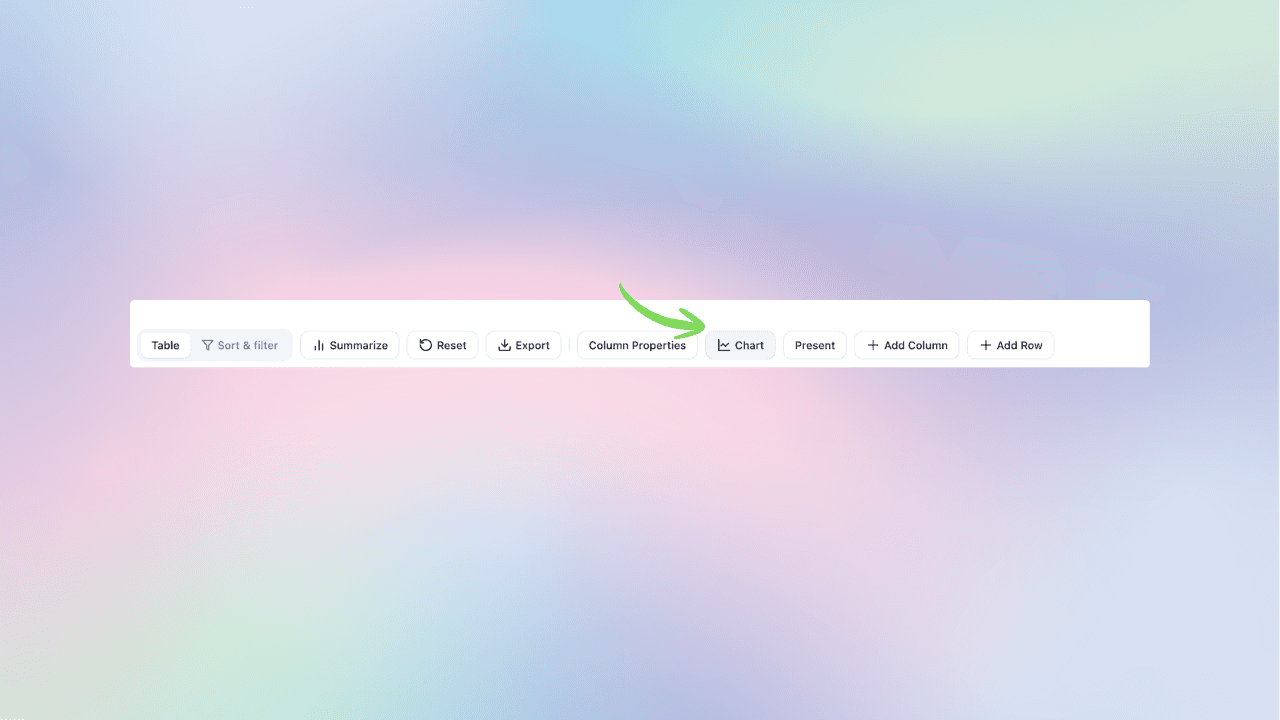
5. Create a Chart
Next, select Chart to visualize the incoming data.
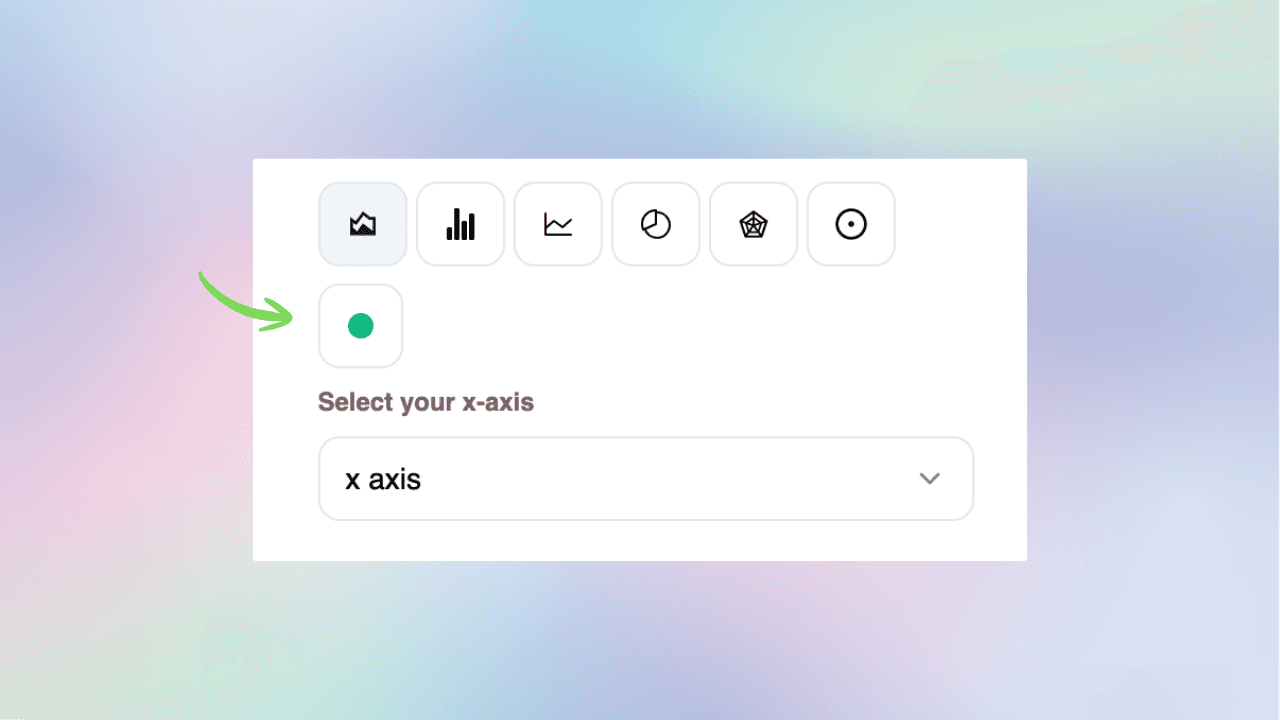
6. Enable Live Charting
Choose the Live chart option to display a continuously updating price chart.
Lychee’s charting interface is inspired by modern streaming chart libraries, allowing prices to update smoothly as new events arrive.
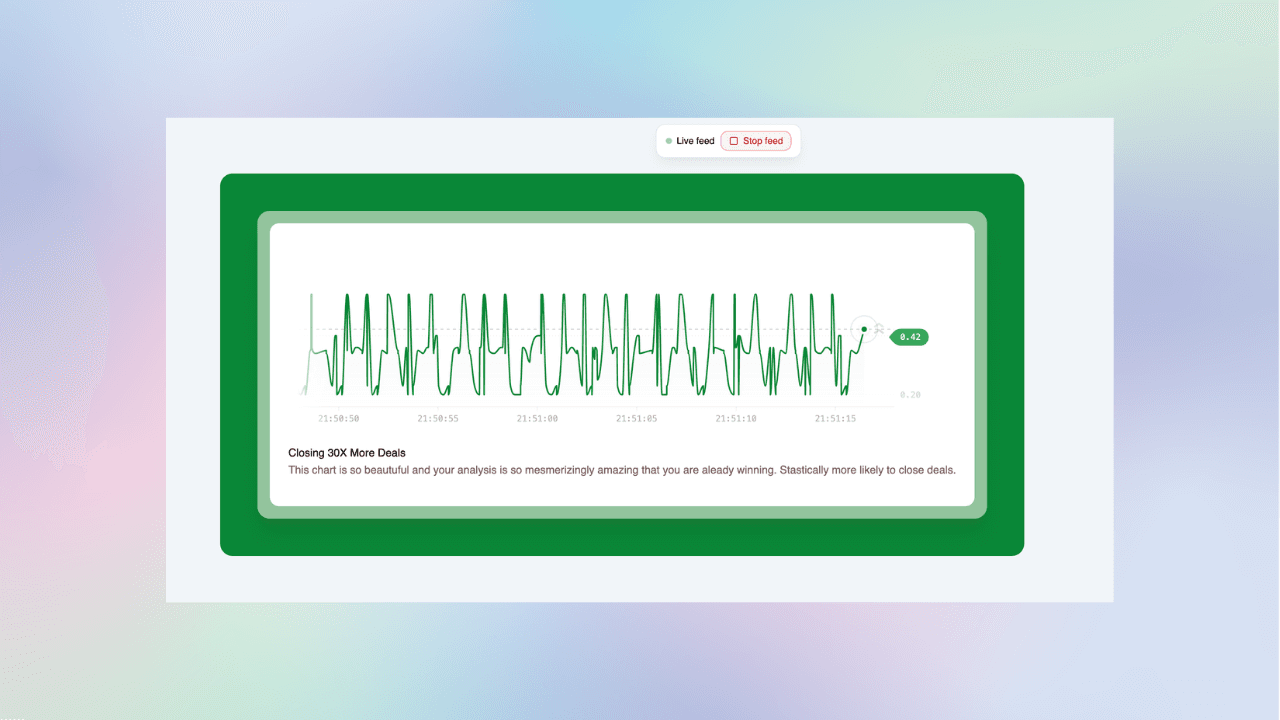
7. View the Live Market Chart
That’s it.
You now have a live updating chart of Polymarket price data streaming directly from the market WebSocket.
Exploring Other Real-Time Market Streams
The price feed is only one of several real-time data streams available.
The same workflow can be used to connect to additional market events such as:
- orderbook updates
- last trade price events
- liquidity changes
- bid / ask spreads
Each of these data streams provides a different perspective on how prediction markets evolve.
Future guides will explore these endpoints in more detail and show how to combine them for deeper market analysis.
Final Thoughts
Prediction markets generate a constant flow of structured data as traders update their beliefs about future events.
By accessing the Polymarket market stream, you can observe these belief updates in real time.
Live data opens the door to:
- probability tracking
- volatility monitoring
- liquidity analysis
- real-time market visualization
As the ecosystem grows, tools that make this data easier to access and analyze will play an important role in understanding how prediction markets behave.
And this is just the starting point.
Go from raw markets to charts and dashboards in seconds—no code, no CSVs.
Free to explore here · Polymarket, Kalshi, Chainlink & more
More reading
How to Find a Polymarket Market ID, Token ID, Asset ID & Condition ID
Learn how to find Polymarket market IDs, token IDs, asset IDs, condition IDs, slugs, and clobTokenIds for API queries, price history, orderbooks, and market analysis.
How to Track Polymarket Odds Over Time (Visualize Probability Changes)
Learn how to track Polymarket odds over time, visualize probability changes, and measure probability momentum using interactive charts. Build a live Polymarket odds tracker without coding.
How to Pull and Analyze Polymarket Event Data (No-Code)
Learn how to connect to Polymarket’s Events List endpoint, filter and analyze structured event data, and export datasets, from anywhere in the world — no code required.
How to Get Kalshi Historical Data (CSV, EXCEL, No-Code Guide)
Learn how to access, query, and download Kalshi historical data instantly — no coding skills required. Perfect for backtesting prediction markets, visualizing trades, and exporting CSV, Excel, or JSON files.
Polymarket CLOB WebSocket Market Channel: Asset IDs, Prices & Trades
Learn how the Polymarket CLOB WebSocket market channel works, how to subscribe with asset IDs, and how to read real-time orderbook, price_change, last_trade_price, and market events.
Polymarket Gamma API Events Slug: How to Query Events by Slug
Learn how to use the Polymarket Gamma API events slug endpoint, query an event by slug, inspect markets, and extract market IDs, condition IDs, clobTokenIds, outcomes, and slugs.